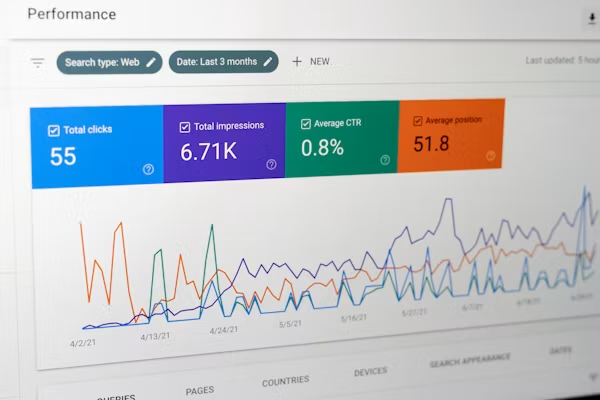
Businesses generate large amounts of data, but raw numbers alone do not provide clear answers.
Aven Analytics focuses on transforming data into understandable dashboards, reports, and insights.
We work with tools such as Power BI, SQL, and Excel to clean, analyze, visualize, and present data in a way that makes important information easier to understand.
Our goal is simple: turn data into information that supports better decisions.
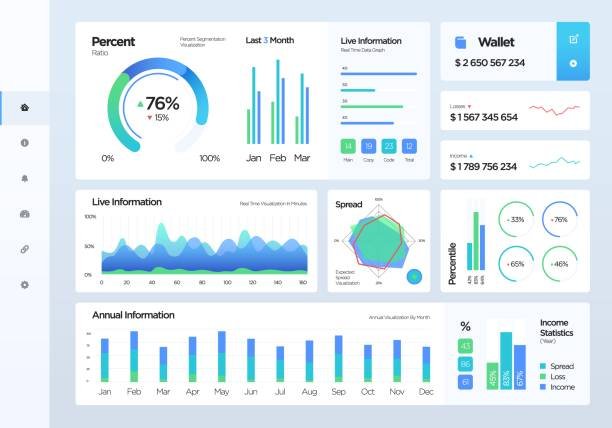
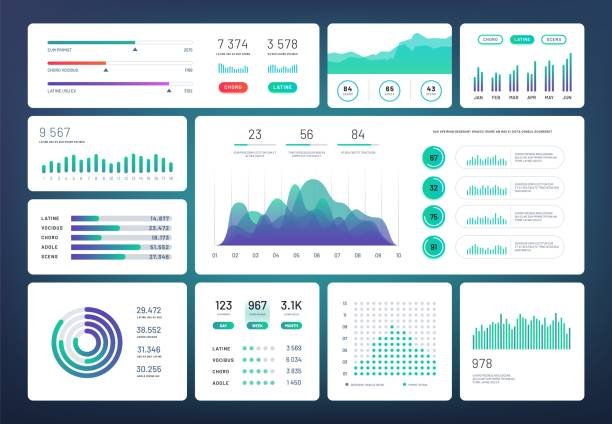
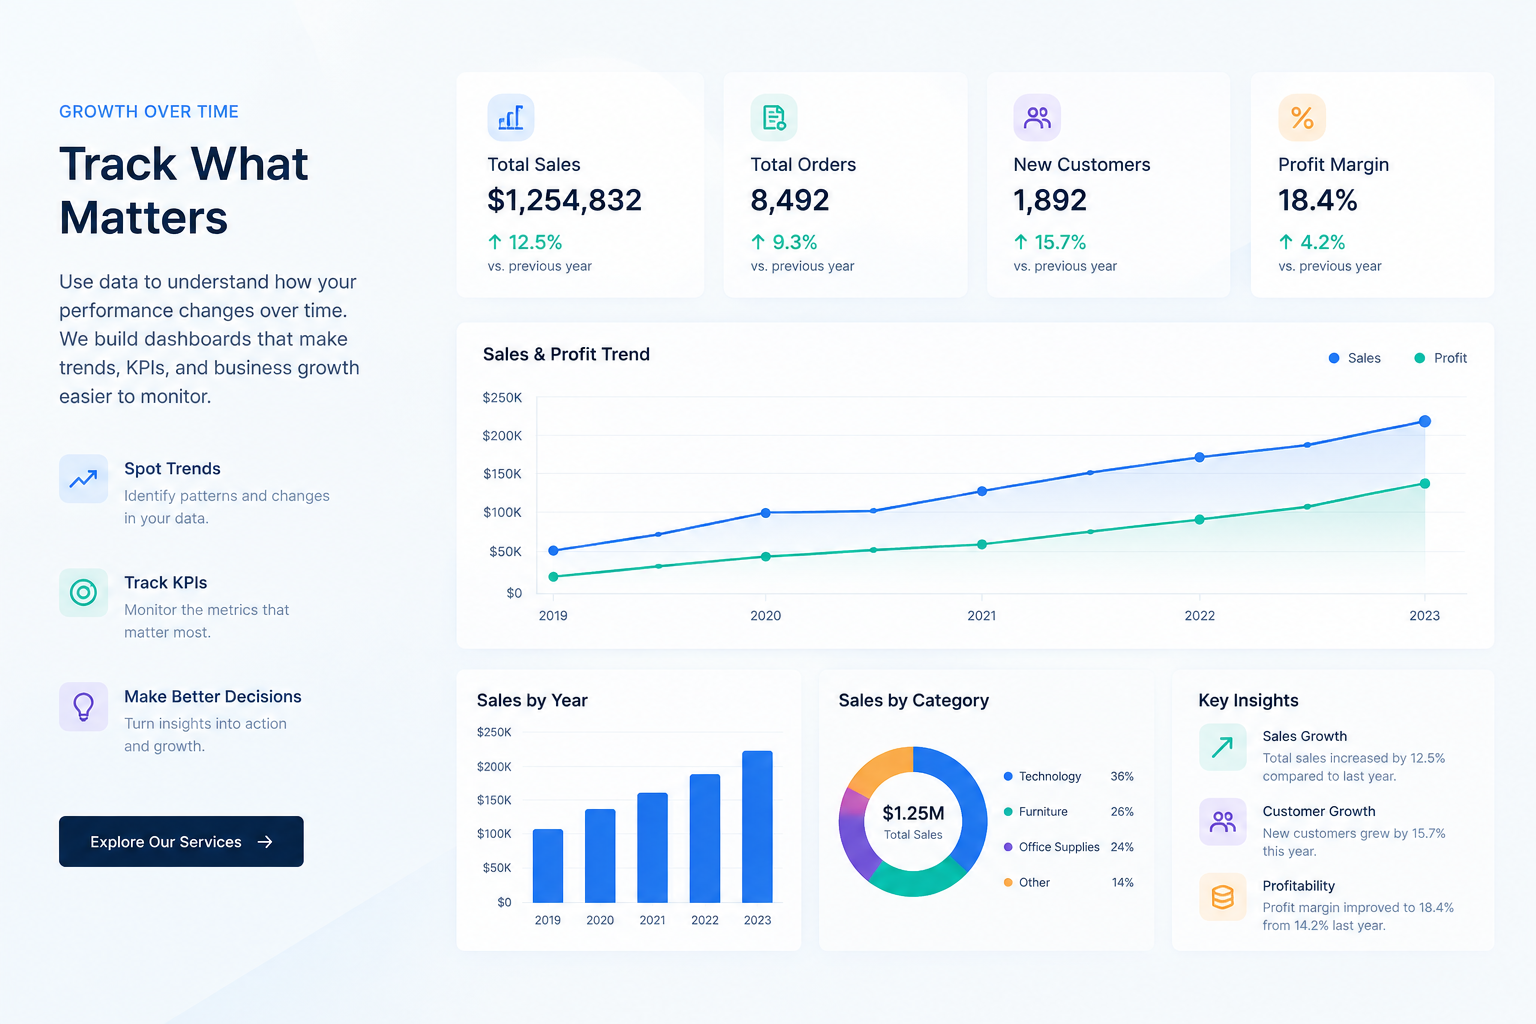
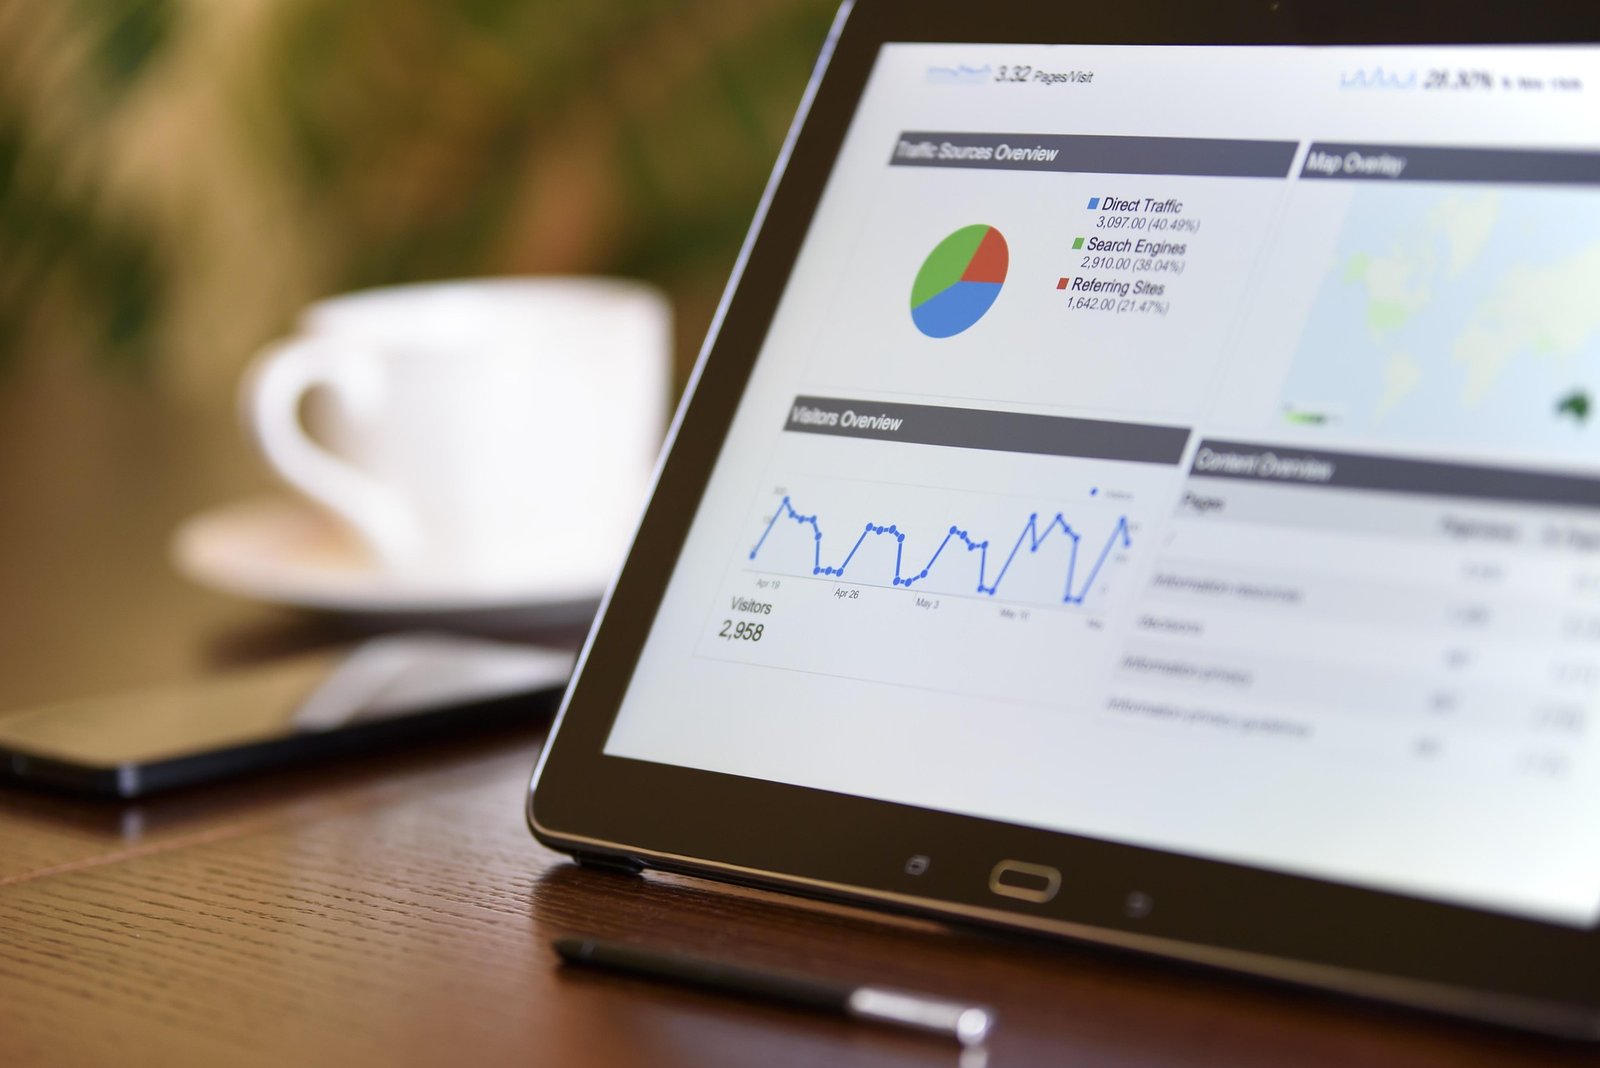
We turn complex datasets into dashboards and visual reports that are easier to understand.
Data-Driven Thinking
We focus on finding meaningful patterns, trends, and relationships within your data.
Practical Solutions
Our solutions are designed around the actual questions your data needs to answer.
Modern Analytics Tools
We work with tools including Power BI, SQL, and Excel to build practical analytics solutions.
Structured Data
Reliable analysis starts with reliable data. We focus on cleaning and organizing data before turning it into insights.
for more information
0317-8098217
what we offer ?
From Raw Data to Actionable Insights
Power BI Development
Build interactive dashboards and reports that make your most important business metrics easy to monitor.
Data Analysis
Analyze datasets to discover trends, patterns, relationships, and useful business insights.
SQL Analysis
Use SQL to query, manipulate, aggregate, and analyze structured business data.
Data Cleaning & Transformation
Prepare raw and inconsistent datasets for accurate analysis and reporting.
Dashboard Design
Create clean, intuitive dashboards focused on the information that matters most.
Business Reporting
Turn data into structured reports that help stakeholders understand performance and identify important trends.
OUR PROCESS
From Data to Insights in Three Steps
1
Understand
We start by understanding your business questions, objectives, data sources, and reporting requirements.
2
Analyze
We clean, transform, explore, and analyze the data to identify meaningful information and patterns.
3
Visualize
We turn the results into clear dashboards, reports, and visualizations that make the insights easier to understand and use.
Frequently Asked Questions
Clear Answers to Common Questions
What services does Aven Analytics provide?
Aven Analytics provides data analytics and business intelligence services including Power BI dashboards, SQL analysis, data cleaning, visualization, and business reporting.
What tools do you work with?
Our primary tools include Power BI, SQL, Excel, DAX, and related data-analysis technologies.
Can you work with my existing data?
Yes. Existing datasets can be analyzed after reviewing their structure, quality, and requirements.
Can you build a custom Power BI dashboard?
Yes. Dashboards can be designed around the specific KPIs, metrics, and questions relevant to a project.
Your Data. Our Analytics. Better Insights.
Whether you’re starting with raw data or already have an established reporting system, we can help you transform it into dashboards, reports, and insights that are easier to understand and act upon. Turn your data into something you understand.
get in touch
Have a Data Project in Mind?
Tell us about your data, your business problem, or the dashboard you want to build.
We’ll review your requirements and discuss how the project can be approached.